A layer that can be added to ggplot2 plots to change the colour aesthetic
to interpolate values from the blues used in the UKRI logo.
Usage
scale_colour_ukri_c(
  ...,
  colours = ukri_blues(),
  midpoint = NULL,
  space = "Lab",
  na.value = cruk_grey(),
  guide = "colourbar",
  aesthetics = "colour"
)
Arguments
- ...
Arguments passed to
ggplot2::scale_colour_gradientorggplot2::scale_colour_gradient2.- colours
The colour palette to use for the colours of the plot. By default this is the blues from the UKRI logo. Setting this to
"purple"will switch this to the UKRI purples.- midpoint
The midpoint (in data value) of the diverging scale. Diverging scale only used if the midpoint is not equal to
NULL, which is the default.- space
Colour space in which to calculate the gradient.
- na.value
Colour to be used for missing values.
- guide
Type of legend.
- aesthetics
The aesthetic to apply this scale to.
See also
Other Layer:
scale_colour_cgem_c(),
scale_colour_cgem_d(),
scale_colour_cruk_c(),
scale_colour_cruk_d(),
scale_colour_ebio_c(),
scale_colour_ebio_d(),
scale_colour_ukri_d(),
scale_fill_cgem_c(),
scale_fill_cgem_d(),
scale_fill_cruk_c(),
scale_fill_cruk_d(),
scale_fill_ebio_c(),
scale_fill_ebio_d(),
scale_fill_ukri_c(),
scale_fill_ukri_d()
Examples
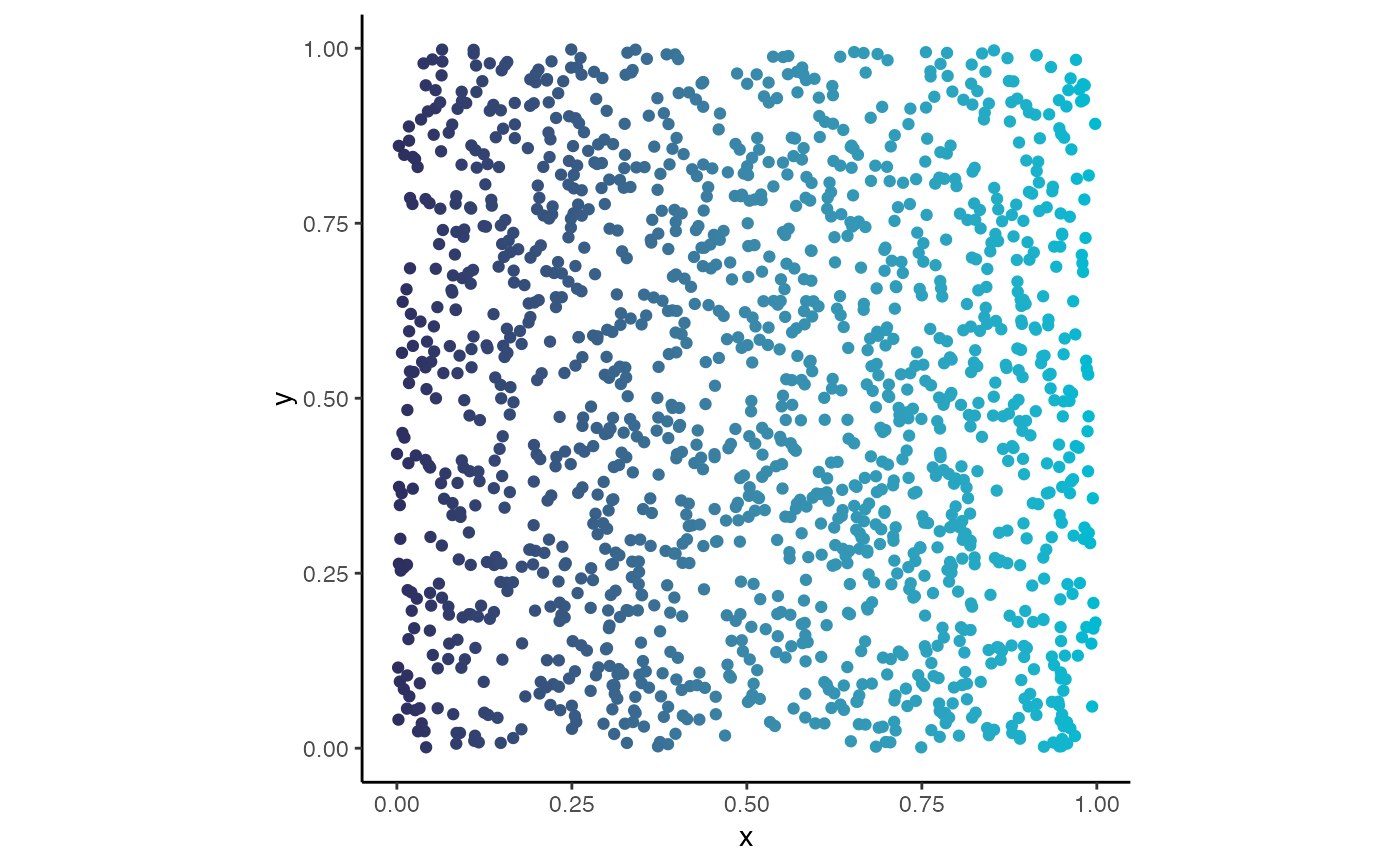
library(ggplot2)

ggplot(
  data.frame(
    x = runif(1500),
    y = runif(1500)
  )
) +
  aes(x = x, y = y, colour = x) +
  geom_point() + theme_classic() +
  guides(colour = "none") +
  coord_equal() +
  scale_colour_ukri_c()
#> Warning: the condition has length > 1 and only the first element will be used


ggplot(
  data.frame(
    x = runif(1500),
    y = runif(1500)
  )
) +
  aes(x = x, y = y, colour = x) +
  geom_point() + theme_classic() +
  guides(colour = "none") +
  coord_equal() +
  scale_colour_ukri_c(
    colours = "purple"
  )
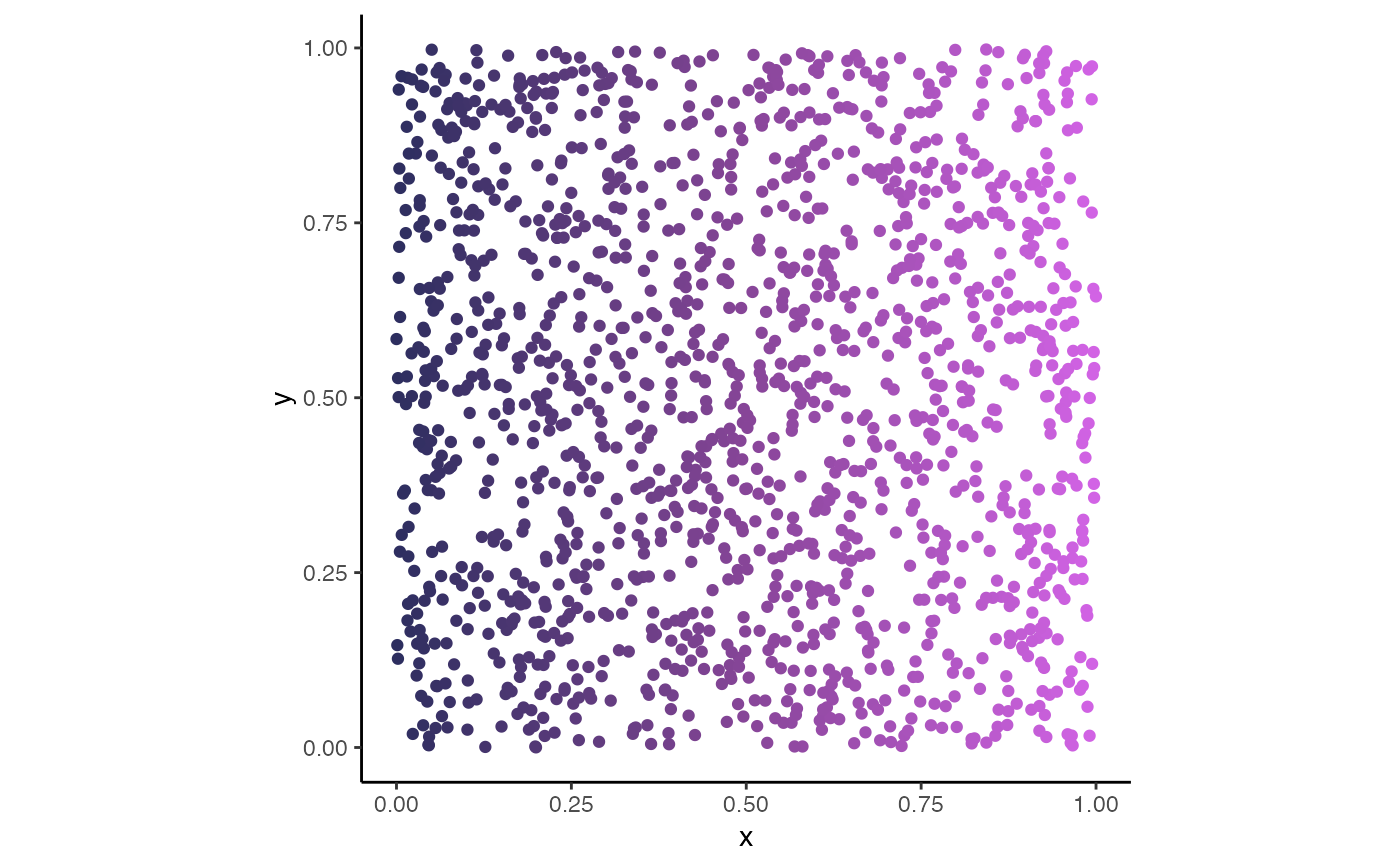
ggplot(
data.frame(
x = runif(1500),
y = runif(1500)
)
) +
aes(x = x, y = y, colour = x) +
geom_point() + theme_classic() +
guides(colour = "none") +
coord_equal() +
scale_colour_ukri_c(
colours = "purple"
)