A layer that can be added to ggplot2 plots to change the colour aesthetic
to interpolate values from the colours used in the EastBIO logo.
Usage
scale_colour_ebio_c(
  ...,
  colours = ebio_colours(),
  midpoint = NULL,
  space = "Lab",
  na.value = cruk_grey(),
  guide = "colourbar",
  aesthetics = "colour"
)
Arguments
- ...
Arguments passed to
ggplot2::scale_colour_gradientorggplot2::scale_colour_gradient2.- colours
The colour palette to use for the colours of the plot. By default this is the colours from the EastBIO logo.
- midpoint
The midpoint (in data value) of the diverging scale. Diverging scale only used if the midpoint is not equal to
NULL, which is the default.- space
Colour space in which to calculate the gradient.
- na.value
Colour to be used for missing values.
- guide
Type of legend.
- aesthetics
The aesthetic to apply this scale to.
See also
Other Layer:
scale_colour_cgem_c(),
scale_colour_cgem_d(),
scale_colour_cruk_c(),
scale_colour_cruk_d(),
scale_colour_ebio_d(),
scale_colour_ukri_c(),
scale_colour_ukri_d(),
scale_fill_cgem_c(),
scale_fill_cgem_d(),
scale_fill_cruk_c(),
scale_fill_cruk_d(),
scale_fill_ebio_c(),
scale_fill_ebio_d(),
scale_fill_ukri_c(),
scale_fill_ukri_d()
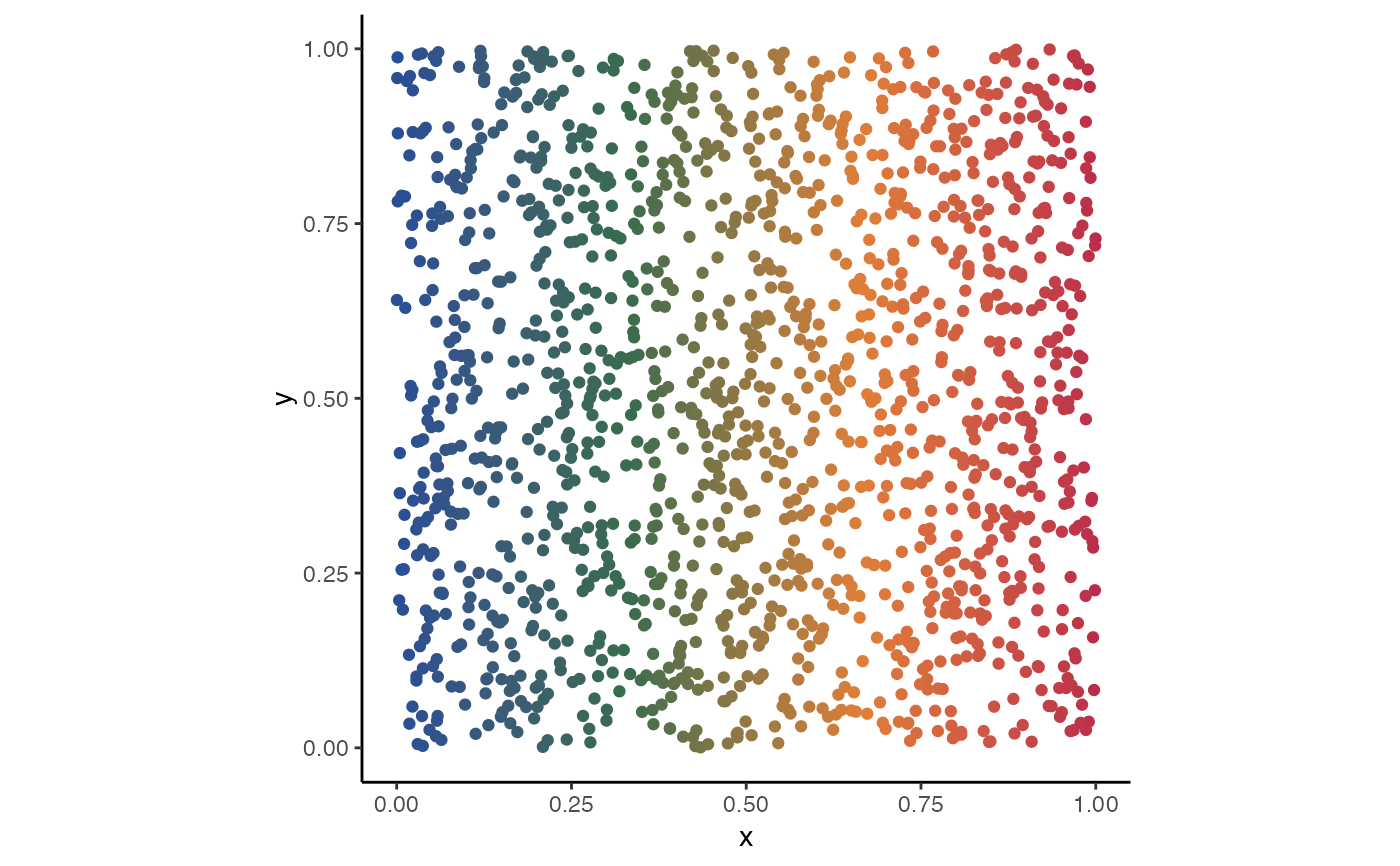
Examples
library(ggplot2)

ggplot(
  data.frame(
    x = runif(1500),
    y = runif(1500)
  )
) +
  aes(x = x, y = y, colour = x) +
  geom_point() + theme_classic() +
  guides(colour = "none") +
  coord_equal() +
  scale_colour_ebio_c()